How do I set up a new account with 1st BASE?
For Singapore and Malaysia customers, you can register for an online account at https://order.base-asia.com/. For other regions, you may contact the local distributor in your respective countries to register the online account.
Who should I contact?
You can email or contact us as below:
| +65 6775 7318 | |
Malaysia | +603-8943-3252 | |
Other Countries | Contact our respective sales representative in your region. Otherwise, please reach us at sequencing@apicalscientific.com | Contact our respective sales representative in your region |
Do 1st BASE offer trials for the Sanger sequencing services?
We offer trials for new customers to try out our Sanger sequencing services. Please contact our sales representative in your region to find out more.
What is the cost for the services?
You will be able to view the price upon ordering on our 1st BASE Online Ordering system. If you are placing an order with 1st BASE for the first time, the pricing displayed might not be updated. Please do not worry as you can still proceed with the ordering. We will update the pricing accordingly as soon as we accept your order. Alternatively, please contact our respective sales representative in your region for pricing details.
Can I send orders outside of Singapore and Malaysia? How do I go about doing it?
Sequencing order collection points are set up in a few locations in Singapore and Malaysia regions. Please contact our respective sales representative to find out more or if you wish to set up a new collection point.
Singapore | Sequencing order collection point available in most institute. Free local collection. |
Malaysia | Kuala Lumpur/ Klang Valley: Our dispatch will collect at your location |
Other Countries | Please contact the local distributor in your respective countries. |
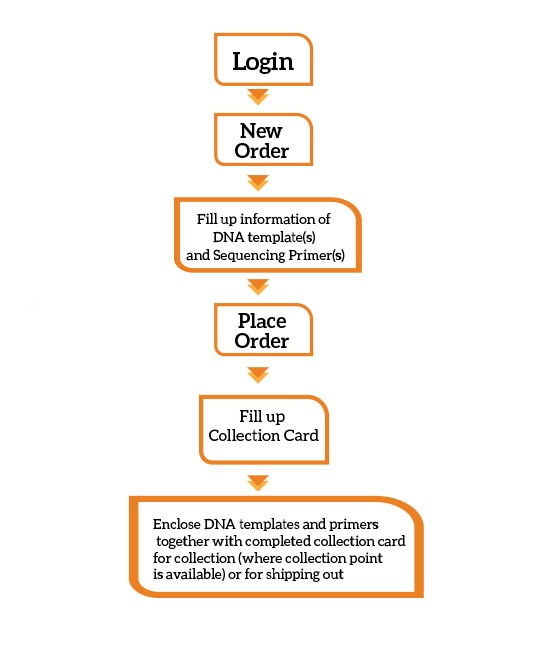
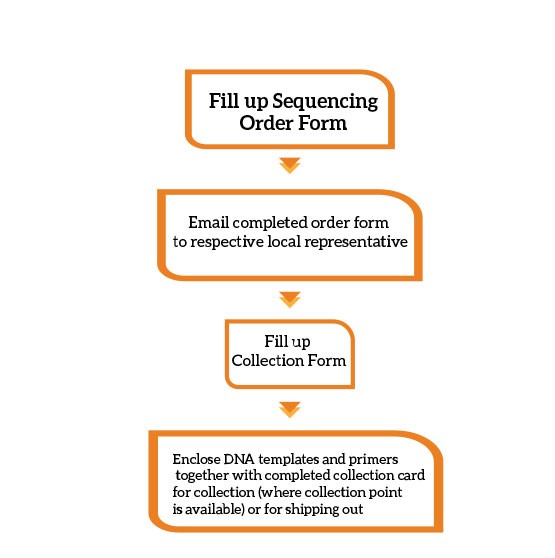
What is the ordering process?
You can place an order with us online via 1oo or email.
Via 1oo:
Via email:
What is the difference between the different services? Which service should I choose?
We offer comprehensive service to meet your needs! You can choose the service based on your DNA template type. If you are unsure, kindly contact us.
| Standard Sanger DNA sequencing service for purified DNA templates. Guaranteed read length of over 1000 bases for good quality DNA templates. |
DNA Sequencing + PLUS | Complete Sanger DNA sequencing solution from unpurified PCR and unpurified plasmid products. Guaranteed read length of over 1000 bases. |
Ready-to-load sequencing | Electrophoresis of purified or unpurified cycle sequencing products on Genetic Analyzers. |
Difficult Template Sequencing (DTS) | Optimized protocol developed for template with secondary structures, high G%, high C%, high GC%, repeat regions, secondary structure or loop structures found in shRNA vectors. Large DNA templates like ss M13 DNA, BAC-end or genomic DNA also can be sequenced with DTS using the sequencing primer that has the proven good priming efficiency. |
Direct Colony Sequencing (DCS) | Direct sequencing of single colony from agar streaks. Guaranteed read length of over 600 bases. |
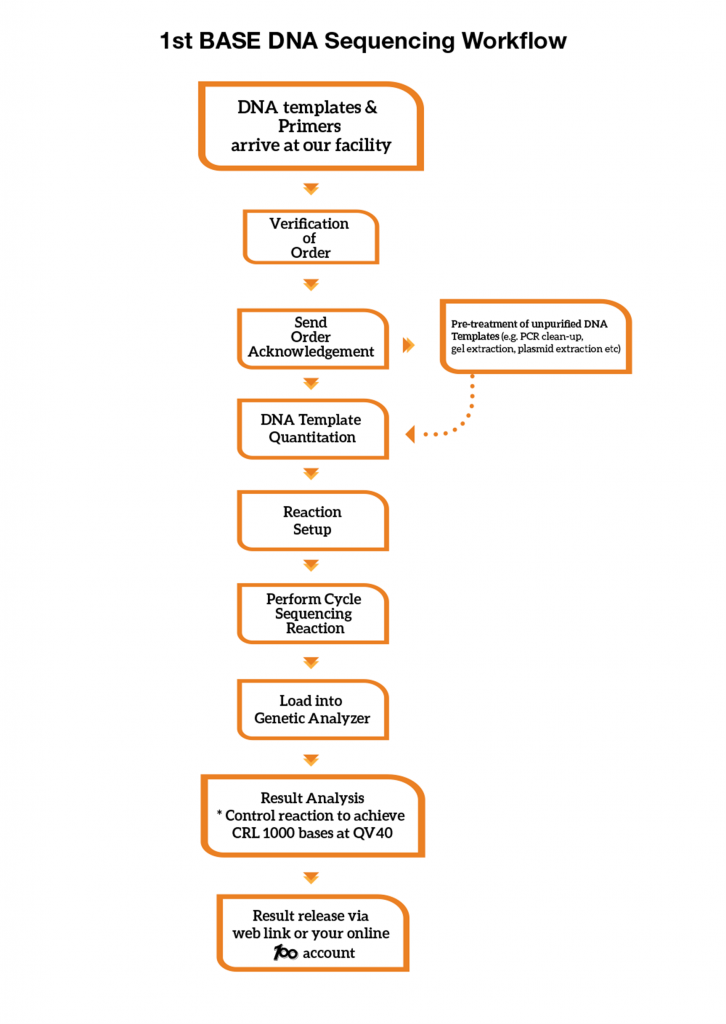
What is the Sanger DNA sequencing workflow?
1st BASE DNA Sequencing Workflow
What is the quality check you have in your workflow?
A control sequencing reaction is performed with every run in our Genetic Analyzer. Sequencing reaction controls is used to evaluate the quality of the overall reactions. Our control reaction must achieve Phred40 data and a minimum CRL of 1000 bases to meet our QC benchmark. We provide our control sequencing electropherogram in each of your sequencing order at no charge.
What are the precautions that I should pay extra attention during prepare the DNA templates for DNA sequencing?
The quality of Sanger sequencing result is closely dependent on the purity and optimum amount of DNA template.
For plasmid DNA:
Most commercial DNA clean-up kits will give DNA of sufficient quality for Sanger sequencing. The most common problem arises from excess salts which usually occur if DNA was eluted in a high salt buffer or diluted/suspended in TE buffers.
For Sanger DNA sequencing, we recommend keeping the plasmid DNA in 10mM Tris-HCI pH8.0 buffer or deionized water. TE buffer also can be used to keep the plasmid DNA; but you must pay extra attention for low copy plasmid, where EDTA from the TE buffer may weaken the sequencing signal. Low EDTA TE buffer or TE Buffer with reduced EDTA will be a better option.
Alternatively, we provide plasmid extraction service as an add-on service.
For PCR products:
PCR clean-up is required to ensure that the DNA is free of contaminants, excess PCR primers and dNTPs. Unpurified PCR products are not suitable for sequencing as the excess PCR primers will interfere the sequencing signals, which the DNA template supposed to be sequenced by the assigned single sequencing primer for each sequencing reaction. It is also highly recommended that an agarose gel is run to verify that the PCR products is single band with correct target size. Purification can be done using any commercially available kits for gel extraction or PCR clean-up. We provide PCR clean-up and gel extraction service as an add-on service.
Can I sequence unpurified PCR products directly?
If the residues of the PCR primers were depleted after the PCR, the noise background generated during the cycle sequencing may not affect the major base calls. However, the presence of the other contaminants (e.g. dNTPs, salts and etc.) could still compromise the quality of the DNA sequencing result to some extents.
If your unpurified PCR products is single DNA band product on agarose gel, you may order DNA Sequencing + PLUS directly. We will purify the PCR products and enable the remaining DNA to be sequenced immediately in the same sequencing order.
If you wish to verify the unpurified PCR products with only 1 sequencing primer and want the purified PCR products to be sequenced using other sequencing primer in the next new sequencing order, you must order Single Pass Sequencing with add-on PCR clean-up purification service in the first place; so that there will be sufficient purified PCR products to be sequenced in your next new order. Do note that 1st BASE will only keep the remaining DNA template for 1 week after the results was released. Thus, it will be much straight forward to have all your desired sequencing primers used in the first sequencing order to minimize delays and avoid disappointment.
Do I need to lyophilize the DNA? Do I need to keep my DNA template is 4oC?
It is not necessary to lyophilize or dry your DNA templates before Sanger DNA sequencing services. Please submit your DNA templates in deionized water or low EDTA TE buffer at room temperature. DNA is stable at room temperature for a few days.
Should I quantify my DNA template before sending for sequencing?
The quality of DNA template is the most common issue in problematic Sanger sequencing reads. The amount of DNA templates used in sequencing reaction can affect the quality of data. Too little DNA template will generate low signal strength while too much DNA templates will generate a ski-slope effect which causes the signal to weaken gradually.
It is essential to accurately quantitate DNA templates prior to sequencing. However, accurate quantification of dsDNA is not easy.
It’s informative to run your DNA template on an agarose gel, using some standard of known concentration and estimate the relative fluorescent intensity following gel staining. DNA ladders/markers can be used as a reference standard since it comes with a known amount of DNA (ng) for each band.
How to estimate DNA concentration of my purified PCR Products confidently from agarose gel photo?
The regular gel photo shall display different DNA intensity for its known DNA Ladder, so that we can use it to estimate the DNA amount of your purified PCR products that loaded next to the DNA Ladder.
By using the example of gel photos below, when we compare the DNA intensity of the purified PCR Products with its DNA Ladder: the known DNA size of 600bp (from DNA Ladder) near to the target PCR products is 12ng and it looks brighter, we can thus confidently say that the purified PCR Products has < 12ng of DNA. If we load only 1µL of purified PCR Products in this agarose gel, we can then estimate the DNA concentration of the purified PCR Products is < 12ng/ µL, which you can take any number between 5ng/µL to 9ng/µL, but not any figure near 12ng/µL.
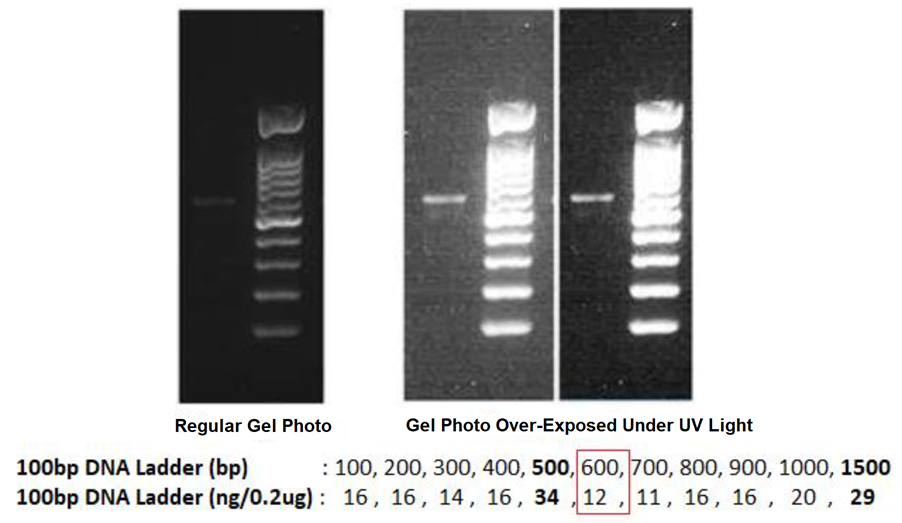
If the agarose gel is over-exposed under the UV light during the gel photo is taken, the displayed intensity of the DNA ladder will not be able to guide us to estimate the DNA amount confidently. Although the DNA intensity of the purified PCR products is higher in this gel photo, but the actual DNA concentration is only 5ng/µL to 9ng/µL.
Why is your measured concentration different from mine?
Generally, there are 2 commonly used methods to quantitate DNA templates. But neither method will show the presence of contaminating salts.
- Agarose gel electrophoresis – Purified DNA should run as a single band on an agarose gel (Uncut plasmid DNA can run as 3 bands: supercoiled, nicked, and liner). Contaminating DNA or RNA will show up in the gel.
- UV Spectrophotometry - The A260/A280 ratio should be between 1.7 and 1.9. Smaller ratios usually indicate the presence of contaminating proteins or phenol. The NanoDrop ND-1000 spectrophotometer takes 1-2 µL sample volumes and can detect concentrations from 1.5 - 3700 ng/µl without dilutions.
Traditional absorbance invariably overestimates DNA. In a finding, Kapp et al (2014) encounter a five-fold difference between absorbance-based method and fluorescent-based method, which could theoretically result in using lower amounts of starting DNA for the downstream sequencing step and cause unsatisfactory results. Discrepancies between the two methods were also reported by Deben et al, O'Neill et al and Simbolo et al (2013). The measurements at 260nm (A260) fluctuate with contaminants and buffer component, mainly because miniprep kits on the market often inevitably introduce some RNA, chromosomal DNA, and other fluorescent cellular material during the purification process that will absorb UV light. These other chemicals won’t necessarily inhibit the sequencing reaction, but they will contribute to the A260 reading. As a result, relying on the spectrophotometer reading alone will cause you to add less DNA template than you think.
Fluorescence assays on the other hand are less prone to interference. Fluorescence-based quantitation is more sensitive and more specific for the nucleic acid of interest. In the technical note from Invitrogen, comparison between the UV absorbance method and the fluorescent method was compared. Nanodrop method was found to shown fluctuation particularly at lower concentration range. Whereas, fluorescence based quantitation generate accurate and precise result across lower concentration range.
Our lab adopts fluorescence-based measurement which might explain the difference in the measured concentration. We take every step to ensure that the quantification process is consistent and accurate for downstream processes. Our laboratory apparatus is calibrated and maintained regularly to ensure they are working within their specified limits.
Kapp JR, Diss T, Spicer J, et al Variation in pre-PCR processing of FFPE samples leads to discrepancies in BRAF and EGFR mutation detection: a diagnostic RING trial Journal of Clinical Pathology Published Online First: 27 November 2014. doi: 10.1136/jclinpath-2014-202644
Simbolo M, Gottardi M, Corbo V, et al. DNA qualification workflow for next generation sequencing of histopathological samples. PLoS ONE 2013;8:e62692
Technical Note: Comparison of fluorescence-based quantitation with UV absorbance measurements Qubit™ Quantitation Platform vs. spectrophotometer
My DNA template shows insufficient amount, can I still send it for sequencing?
We do not recommend sending DNA template of insufficient amount. If you request us to process such DNA template to sequencing, we will try to deliver our best effort guarantee to maximize the success of your sequencing order. Although a specialized protocol will be deployed to maximize the amplification (and there are just so much we can do), we are still unable to guarantee optimal DNA sequencing result.
What is the minimum size of DNA fragment that you can sequence?
Ideally DNA templates should be 100bp and above. With our optimized running protocol and module, we can sequence DNA templates as small as 90-100bp, but this will be subjected to the DNA template quality and the priming efficiency of its sequencing primer.
For DNA templates as small as 75bp, we can perform BigDye Terminator Cycle Sequencing Kit v1.1 at separate run and cost.
For DNA templates less than 75bp, we recommend for the sequencing to be done using Next-Generation Sequencing.
How long will my DNA template and sequencing primers be kept? How can I reuse them for my next order?
We will only keep DNA templates and sequencing primers for 1 week upon receiving them. Please indicate in the order form if you would like us to keep your DNA templates or sequencing primers for further sequencing reactions. A nominal fee will apply for storing your DNA templates or sequencing primers in our laboratories.
When can I receive the result?
Upon the receipt of your sequencing order to our DNA sequencing facility, an order confirmation will be sent to you through email. We typically deliver the sequencing result to you within 48 working hours upon the receipt of your complete and accurate DNA sequencing order. For ready-to-load reactions, results are typically ready within 24 working hours.
How do I receive the result?
Results are downloadable through 1st BASE Online Ordering account or via an email with the password protected web link. The compressed file in .zip format (for Windows), contains the complete sequencing results with (i) electropherogram(s) in .ab1 file, and (ii) fasta sequence in .seq file.
How safe is my result data?
We understand that the confidentiality of your result data is critical. To ensure a high level of security towards the result uploaded, for customers who yet to register an online account with us, we would provide result in email with the weblink that is password protected. The password will only reveal to the email recipient.
What are the software that can be used to view the result?
The electropherogram, saved as .ab1 file, we recommend freeware from Applied Biosystems® Sequence Scanner 2.0 for Windows 10, which enable automatic Quality Control Report at a glance. Anyhow, this file can also be viewed by other freeware like Chromas, FinchTV, and etc.
The fasta sequence, saved as .seq file, can be viewed using notepad.
How long is the result link valid?
The result stored in your online account has no expiry. You may download at your convenience via your 1oo online account.
For customers who do not have the 1oo online account, the web link provided in the email to download the results has a validity of 3 months.
My access code is invalid. How do I get a new access code?
Please contact us through webchat or email by indicating your sequencing order ID and the registered email address of recipient for verification, so another access code can be provided to you via email.
I have encountered an error when I want to download my results online via 1st BASE Online Ordering account. What should I do?
Please contact us through webchat or email by indicating your online sequencing order ID and the registered email address of recipient for verification, so that we could assist you directly via webchat or email.
General guideline for a good design of sequencing primer
Ideally, sequencing primer should be designed 100 bases upstream of your sequence of interest. Below are some other considerations when doing your primer design:
- Length of primer to be between 18-25 bases
- GC content to be between 40-60%
- Melting temperature at around 55-60°C
- Check for significant hairpins (>3bp) and homodimerization
- Choose your primer desalted
Design tool
Many commercial oligo providers offer online design tools which you can use. See the link to IDT’s OligoDesigner.
How to view Sequencing Traces?
For .seq file, it is the nucleotide fasta sequences extracted from electropherogram, and can view by Notepad or Text.
For .ab1 file, it is the electropherogram or sequencing trace file that requires specific software to view. We highly recommend using Applied Biosystems® Sequence Scanner 2.0 software to view any Sanger electropherogram or sequencing trace file. The weblink to download this freeware is provided with each release of 1st BASE DNA Sequencing Order. There is a minimum system requirement to install this software completely. The installation window will check your computer system during installation.
Alternatively, .ab1 file can also be viewed using Chromas, FinchTV, DNA Baser and etc.
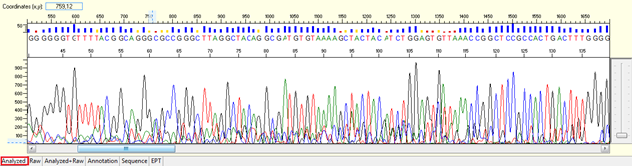
Good Sequence Trace
It is important to identify what calls as a good sequencing trace. Our sequencing results show you the confidence of each base called by using KB Basecaller software. The confidence level is showed as quality value (QV) for each base.
Trace view for good sequence using Sequence Scanner software:
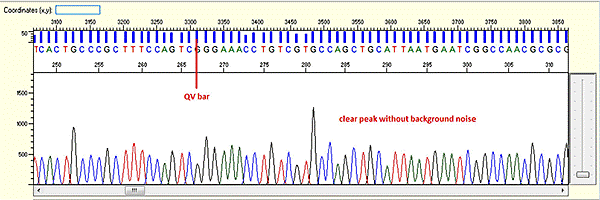
A good sequencing trace data will contain: -
- Continuous long stretch or un-interrupted good quality value (QV) of the basecall. The QV will be displayed as rectangle bars at the upper part of the electropherogram.There are 3 categories of QV bars: -
- Blue: high quality with >= QV 20
- Yellow: medium quality with QV 15 to 19
- Red: low quality with QV < 15
- Well defined peaks with almost no or very minimum of background signal.
For sequencing trace of plasmid DNA or long PCR product (>1000bp), we will not be able to see the end of the trace (or we called as stop point) as the template size is larger than what the electrophoresis can separate. There should be a continuous read length (CRL) with good QV until 850 bases, then the resolution of the electrophoresis will gradually loss and there will be more low quality QVs.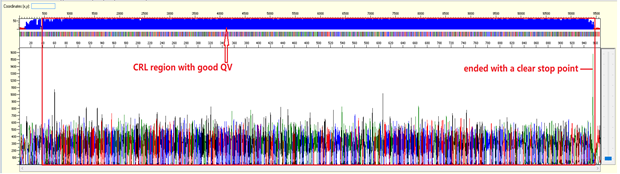
- Continuous long stretch or un-interrupted good quality value (QV) of the basecall. The QV will be displayed as rectangle bars at the upper part of the electropherogram.There are 3 categories of QV bars: -
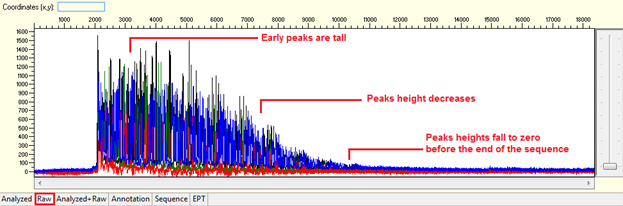
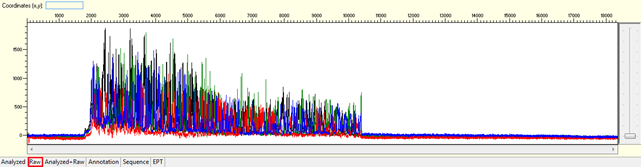
Early signal loss
Pattern: Ski slope configuration of the trace.
The sequence starts with high quality peaks but become messy in the downstream. The raw data will show a good signal intensity at the beginning of the sequence and decreases when the sequence continues.
Trace view for early signal loss sequence using Sequence Scanner software:
- Causes:
- Improper amount of DNA template.
Too much starting DNA template will cause the used up of the chemistry at the beginning stage and thus little was left over for longer extension. For example, when the actual DNA template size given is too much shorter (e.g., 750bp) than what indicate in the order form (e.g., 1500bp), we may overload DNA template during the cycle sequencing.
Insufficient of starting DNA template, will cause fewer extending fragments generated in the sequencing reaction and thus the signal decrease when the sequencing continues. For example, when the actual DNA template size given is too much longer (e.g., 1500bp) than what indicate in the order form (e.g., 750bp), we may put too little template DNA during the cycle sequencing.
- Present of contaminants in the DNA template / sequencing primer.
Present of contaminants (like RNA, phenol, ethanol, EDTA and salts) in the sample will give rise to premature termination because it affects the activity of the polymerase which leads to overabundance of short fragments generated.
- Difficult region within the DNA template.
DNA polymerase had difficulty to process through some sequence context, for example homopolymer sequences, repetitive sequences, and region with high GC or AT content.
- Degrading DNA template.
Degrading template DNA affect the amount of full template DNA which present in the cycle sequencing reaction. Extended fragments for degrading template will be short and the data will be noise with higher baseline especially at the start.
Solutions:
- We 100% quantify each DNA template before cycle sequencing. We will thus be able to calculate the optimum volume required for each DNA template. Thus, providing us the correct or approximate size (less than 100 bases different from the actual size) of DNA template will prevent too much/ too little DNA template used in the cycle sequencing reaction. Please refer the guideline provided in our Order Preparation and Submission.
- Any commercial column purification kit will be able to remove contaminants effectively. A good advice for researcher that purifying bulk samples, we highly recommend processing the purification in several batches carefully. For purification kit using high salt as binding buffer, a skilful laboratory practitioner will prevent salts from contaminating the final elution. Alternatively, we also offer Sample Preparation and Quantification Services before sequencing.
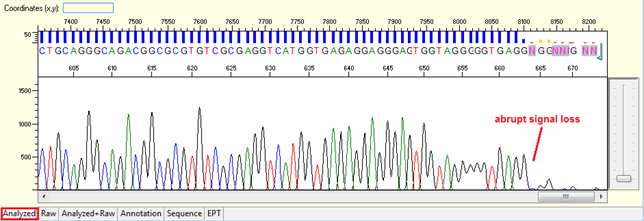
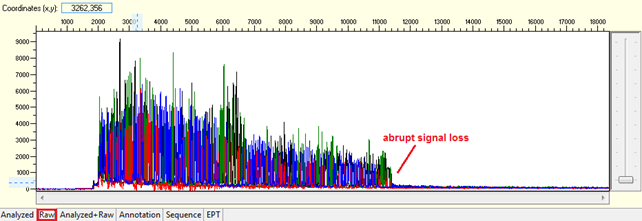
Abrupt signal loss
Pattern: The signal is good before, and it suddenly terminates or drops without continued basecalling.
Trace view for abrupt signal loss sequence using Sequence Scanner software:
Causes:
- Difficult region found in the sequence, which stops the polymerase reaction.
DNA polymerase had difficulty to process through some sequence context, here is the homopolymer, repetitive sequence and high GC or AT content.
- Formation of DNA secondary structure.
The complementary regions fold up on themselves forming hairpin structures that the polymerase cannot pass through.
Solutions:
- Sequence from the opposite strand.
- Order our Difficult Template Sequencing Service, which uses an alternative cycle protocol to sequence the difficult regions.
- Difficult region and DNA secondary structure from PCR product template tend to fail to be sequenced; cloning will be an option to get stable and thus longer read.
Alternatively, we provide DNA cloning under our Molecular Biology Services before cycle sequencing. Please enquire.
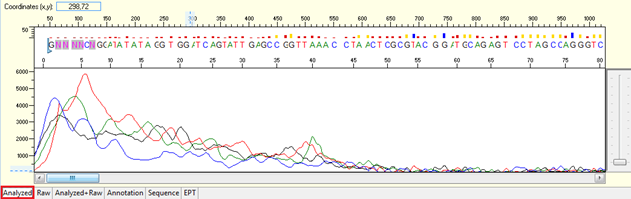
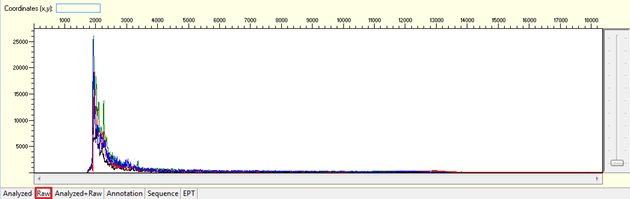
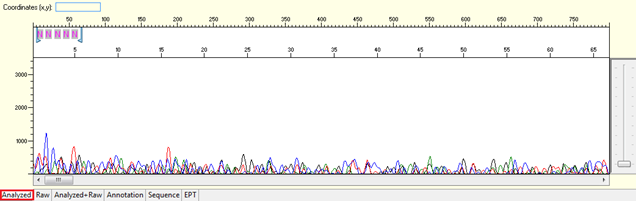
Noisy data with weak signal or no usable signal
Pattern for noisy data with weak signal: Undefined peaks, no continuous read length (CRL), and majority having low quality QV bars.
Trace view for noisy data with weak signal sequence using Sequence Scanner software:
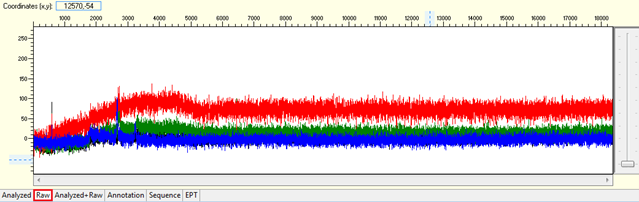
Pattern for no usable signal: Data showed only 5Ns. The sequence trace file may not be able to open by using certain software.
Trace view for no usable signal sequence using Sequence Scanner software:
Causes:
- Too little DNA template or sequencing primer in the reaction.
- Inhibitory contaminant present in template.
Present of contaminant (e.g salt, ethanol, phenol, RNA, etc.) will inhibit the binding of sequencing primer or polymerase to the DNA template to start the reaction.
- Degraded DNA template or sequencing primer.
- No priming site/ weak priming efficiency.
Solutions:
- Quantify your DNA template through gel electrophoresis is highly recommended. For short DNA templates, as long as there is a visible DNA band when 1µL of your purified DNA loaded in agarose gel, it will be sufficient to be sequenced. However, large DNA templates will require more DNA amount to get the optimum reads. Please refer the guideline provided in our Order Preparation and Submission.
- Checking the purity of the dsDNA at ODA260/280 ratio with spectrophotometer e.g Nanodrop is recommended. A pure dsDNA should have ODA260/280 ratio between 1.8 to 2.0. In our opinion, if you are using a commercial kit, and they are not expired, the quality of the purified sample should be working well for sequencing typically. The contamination that leads to weak/ no usable signal usually is the serious degradation of DNA templates.
- Contamination with DNase tend to cause different degree of degradation. Elution with TE buffer can help to protect your DNA from degradation, but EDTA in the TE buffer is one of the inhibitors for sequencing. To avoid inhibitory effect of EDTA in the sequencing reaction, you must make sure the DNA amount that present in the sample is higher/ fall under our sample requirement.
- If you are sequencing a purified plasmid DNA, we highly recommend using the vector’s sequencing primer for your first reaction to avoid disappointment.
For purified PCR products, most of the researchers will use one of their PCR primers as sequencing primer. If the design of PCR primers also fulfil the requirements as a sequencing primer, it will be fine.
- If you are sequencing a purified plasmid DNA, we highly recommend using the vector’s sequencing primer for your first reaction to avoid disappointment.
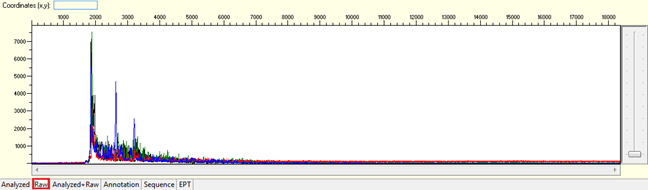
Noisy data with strong signal or high level of background noises
Pattern: Multiple overlapping peaks with strong signal from beginning. The secondary peak from the same position may be the same, lower, or higher than the major peak.
Trace view for noisy data with strong signal or high level of background noises using Sequence Scanner software:
Causes:
- Unspecific priming site.
Presence more than 1 region within the DNA template, which complement partially to the sequencing primer. This cause the unspecific priming of the sequencing primer, and thus they will be more than 1 type of extension products produced from a single reaction tube. During the capillary electrophoresis, they only do the job of size separation. If the extension product is not unique at each size, the signal will be mixed.
- Trace of excess PCR primers in the DNA template.
If the PCR products are not purified before sequencing, the excess PCR primers will act as sequencing primer in the sequencing reaction. Each primer will give different cluster of extension products, which lead to mixed signals.
- Presence of more than one DNA template.
- Occasionally, we will find some purified PCR products show more than 1 one DNA band in the agarose gel photo. Most of the commercial PCR Clean-up kits will not be able to remove the contaminated double stranded DNA or primer dimer. If the sequencing primer can bind on these unspecific DNA bands or primer dimer, it will generate different cluster of extension products and being analysed together to with the major extension cycle sequencing products, which leads to mixed signal. In some cases, it is pretty easy to identify the mixed signal under this category. For example: you have an unspecific DNA band at the size of 200bp, and your target PCR product is at the size of 750bp; you will found the mixed signal will stop near the region of 180-base, following is the clean signal until the end of the sequencing trace.
- There is a mutation in your DNA template, which causing frame shift deletion in the sequencing result. 1 frame shift = 1 amino acid = 3 basepairs. If your actual target PCR products is 750bp, a frame shift deletion sample will have both 750bp and 747bp of PCR products. You will not be able to distinguish such a small different in size using any type of agarose gel electrophoresis. But the sequencing result will show different end point with 3 bases of differences. The mixed signal will start immediately after the mutation site, due to different signal from the extension products. This observation is however limited to the PCR product size. When the size of PCR products is greater than 850bp, it is very difficult to judge the different of the end point since the resolution of electrophoresis gradually loss beyond 850 bases.
- Sequencing primer with low annealing temperature.
When the Ta is lower than 48°C, we will follow your recommended Ta on the order form. The same Ta may work for your PCR, but not necessary works for sequencing. PCR is an exponential reaction that involves 2 PCR primers, but sequencing is a linear reaction that involves 1 sequencing primer.
Solutions:
- Redesign primer specifically for sequencing. If you are sequencing a plasmid DNA, the vector’s primer usually works very well. Alternatively, we help our customers to design and synthesis sequencing primer. Please enquire.
- Optimize the PCR protocol to have depleted primers during the end of PCR, so you can send your unpurified PCR products directly for sequencing. However, sometimes it will fail when the PCR out of control. The best safeguard is to purify your PCR products before sequencing. Alternatively, please order purification service before sequencing.
- Examine your purified DNA template on agarose gel before send for sequencing. If there is more than one DNA band observed on agarose gel, purify them with gel extraction purification rather than PCR clean-up.
- If you are bothering with the DNA template that showing mutation, the best solution is to clone the fragment and pick some colonies for sequencing. You should justify the cost of DNA cloning only if you are really interested with the mutated fragment. Otherwise, put it aside and sequence the next sample.
- If you are using one of your PCR primer as your sequencing primer, you may simply compliance the rules of sequencing primer when select the best PCR primer that designed by the primer software.
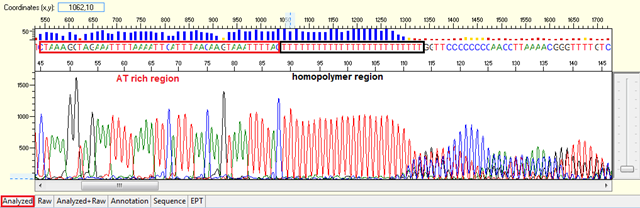
Difficult template (homopolymer, repetitive sequence)
Pattern:
- Homopolymer: Noisy data after a long stretch of mono- (homopolymer) or di-nucleotide repeat.
- Repetitive sequence: Noisy data after a region of the template DNA that is especially high in one or two of the nucleotides.
Trace view for homopolymer (difficult template) using Sequence Scanner software:
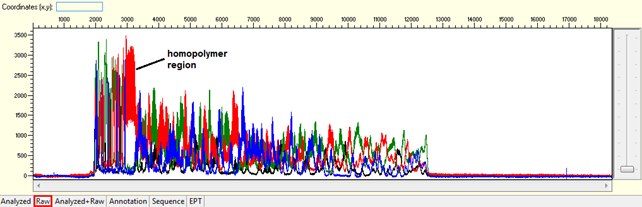
Causes:
- Polymerase did not pair correctly with the template.
The polymerase dissociates and re-hybridized in a different location when meet with a long stretch of mono- or di-nucleotide repeat generating various sized fragments and creating mixed signal after the region. This normally will generate a slippage pattern in the results. The condition tends to be more problematic in PCR products.
Solutions:
- For PCR products, clone the fragment into a holding vector will help to stabilize the sequencing through the same homopolymer region. It is advisable to test on a few samples firstly before use on large number of samples.
- Sequence from the opposite strand.
Although the sequencing will still fail during passing through the same homopolymer region, but the alignment will be successful. E.g. AAAAAAAAAA… will align with TTTTTTTTTT… from the opposite strand. You probably will lose the information of how many repeats of A. But if this is not what you are looking for, it is still worth for trying to save the cost from cloning.
- Use anchored sequencing primer
The most common anchored primer is 21TV, where T is repeated for 21 units, followed by a degenerated primer of V (mixed of G, C and A). It looks like this: TTT TTT TTT TTT TTT TTT TTT V.The anchored primer will bind specifically on the homopolymer region and allows the polymerase to work normally right after them. It works very well when there is only ONE homopolymer region found within the DNA template. This however will lose some information (~ 20 to 30 bases) after the priming site, which is 1 of the disadvantages for BigDye Terminator v3.1 chemistry. If you need to recover this lose region, you need to have another sequencing primer that either sequence from the opposite strand until reaching the homopolymer region, or the original primer that binds upstream from the anchored primer.
Noise up to a specific point
Pattern: Data showing noisy peaks from the start until a specific point. The continue data showing good QVs.
Trace view for noise up to a specific point using Sequence Scanner software:
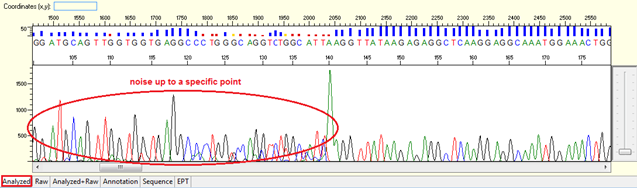
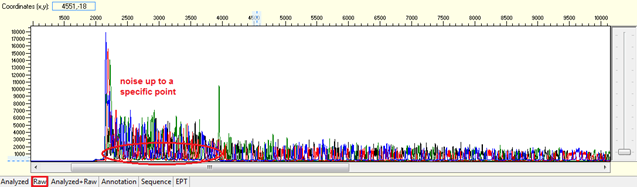
Causes:
- Contamination of primer dimers.
The contamination of primer dimers will generate noise up to 150 bases from the beginning of the sequencing trace. Normally primer dimers can be seen as a cloudy band/ spot in the bottom of agarose gel quantification.
- Contamination of smaller fragment/ illegitimate products.
Instead of seen as a cloudy band/ spot in the bottom of agarose gel quantification, smaller fragment/ illegitimate products will be seen as DNA band. In some cases, they are not easily detected using agarose gel when the loading volume is smaller than 5µL. They are not necessary generate high level of noise, especially when there is a high similarity of their sequence with the target fragment. But you can trace them easily by detecting the end point of extension products that produced by these smaller fragment/ illegitimate products in the beginning of the sequence. Their end point is just like the other PCR products that usually end by a high A peak by the Taq polymerase.
Solutions:
- The quick way is to reduce the amount of PCR primers during conduct the PCR. It works fine only if your PCR primers do not have any degenerate base(s).When you design your PCR primers, use the software to choose the best PCR primer sequence that does not perform self-dimers.
- If you able to recover this region from your opposite sequencing result, what you need to do is probably just cut off/ trim off the noise region before performing the pairwise alignment. This is workable if your DNA template is short (<850bp).
- The easy way to resolve this is to gel purify the DNA template before sequencing.
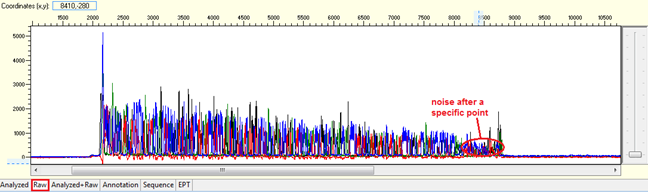
Noise after a specific point
Pattern: Data is good at the beginning turns to double or more peaks after a specific position.
Trace view for noise after a specific point using Sequence Scanner software:
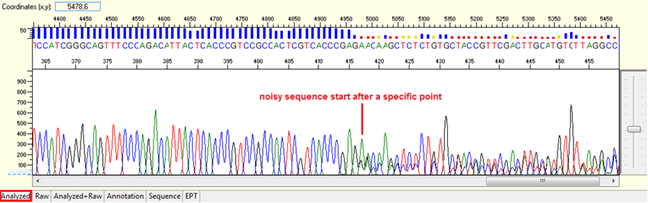
Causes:
- Mixed preparation of a plasmid DNA sample.
There is more than one colony is picked and extracted for sequencing. The noise is found right after the multiple cloning site (MCS).
- Frameshift mutation.
Insertion or deletion of nucleotide occur in PCR product. The noise will start right after the mutation site.
Solutions:
- Re-extract the plasmid DNA from the single colony to re-sequencing.
- The best solution to sequence the mutated samples is still to clone the fragments and pick few colonies for sequencing. You should justify the cost of cloning only if you are really interested with the mutated fragment. Otherwise, you should sequence another sample.
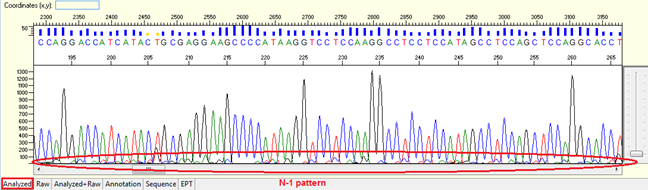
N-1 pattern
Pattern: Overlapped peaks throughout with the second peaks generally 1 base smaller and being the same base as that of the true base immediately to the right. It looks like a small “tail” before the peak of the correspondent nucleotide.
Trace view for N-1 result pattern using Sequence Scanner software:
Causes:
- Poor synthesis quality of the sequencing primer because of low coupling efficiency.
If the contamination of N-1 primers is higher than 10%, it will be detected from the sequencing reads and affects the QVs.
The bad sequencing primer will affect each reaction without a miss. - Mis-priming
The same sequencing primer works very well for the other DNA templates in the same order, but only shows this pattern on some selected DNA templates. - Degrading of sequencing primer.
Degrading PCR primer may carry truncated oligo with -1, -2, -3… bases from the full length primer and affect the priming of the sequencing primer to the DNA template.
Solutions:
- Ask replacement from your primer synthesis company. A new synthesis usually will resolve this problem immediately.
- Re-design the sequencing primer by extending the primer length will help to increase the priming specificity. We can certainly help you in the sequencing primer design and synthesis. Please enquire.
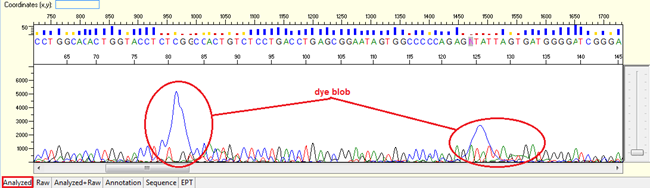
Dye blobs
Pattern: The sequence contain dye blob may or may not affect the basecalling.
Trace view for dye blob result using Sequence Scanner software:
Causes:
- Unincorporated dye terminator molecules that did not remove efficiently during the steps of post sequencing clean-up.
- Degraded DNA template.
Solutions:
- When we see dye blobs, we will automatically re-run the reaction. If you notice this in your results and you are very sure that the DNA template is freshly prepared, kindly contact us to request for the re-run.
- Use freshly prepare DNA template for re-sequencing.
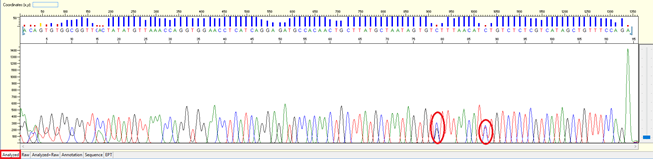
Single Nucleotide Polymorphism (SNP)
Pattern: A clear double peak present at a specific position within the continuous read length (CRL).
Trace view for result with SNP using Sequence Scanner software:
Cause:
- The nature of genomic DNA that carrying SNP in the different allele of the gene. When PCR, it generates mix of PCR products which have one base different.
Solution:
- SNP should not affect the analysis of a sequencing result. However, if one really wishes to get a clean sequence, DNA cloning will be an option before sequencing.
Model of Genetic Analyzer use
We are using ABI PRISM 3730xl Genetic Analyzer developed by Applied Biosystems, USA.
Sequencing Chemistry
The basic sequencing chemistry that we are using is BigDye® Terminator v3.1 Cycle Sequencing Kit
https://assets.thermofisher.com/TFS-Assets/LSG/manuals/MAN0015666_BigDyeTerminator_V3_1_CycleSeq_QR.pdf
Sequencing Protocol
We using the standard protocol as suggested by the sequencing chemistry for preparing the sample for cycle sequencing
https://www.thermofisher.com/my/en/home/life-science/sequencing/sanger-sequencing/sanger-dna-sequencing.html
Sequencing Signal Analysis
We are using KBTM Basecaller to determine the result from the signal generated from Genetic Analyser https://tools.thermofisher.com/content/sfs/brochures/cms_040500.pdf